A retail chain receives a study: online sales in its category are growing at double digits a year. The proposal is to open its own marketplace, with outside sellers. The plan shows growth, market share and commission revenue. It doesn’t show who will keep the margin.
That’s the Five Forces question. A market can grow a lot and leave little for those in it, because the value goes to customers who compare prices, to suppliers who negotiate well or to competitors willing to lose money. The model helps you see this before investing.
What the Five Forces are
The model was presented by Michael Porter in 1979, in How Competitive Forces Shape Strategy, and updated by him in 2008, in The Five Competitive Forces That Shape Strategy, both in Harvard Business Review. The central argument: managers tend to see competition too narrowly, as if it happened only among direct competitors. The contest for profit also involves customers, suppliers, potential entrants and substitutes.
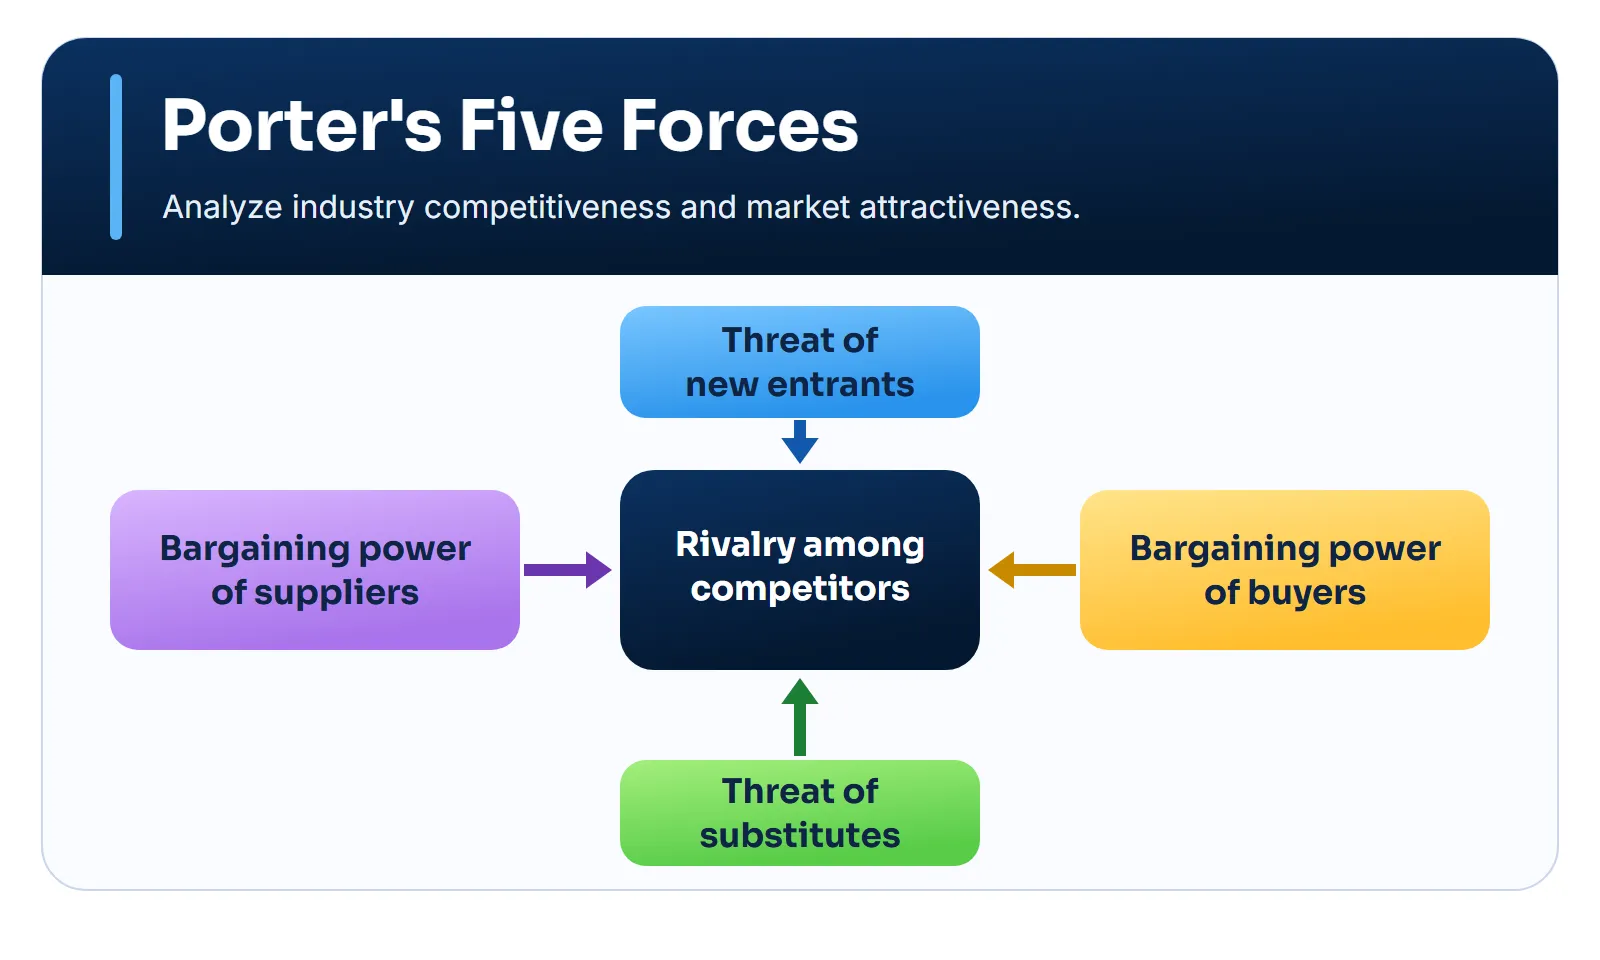
The key to understanding the model is this: an industry creates economic value, and the forces determine how that value is split. One part stays with the companies. Another is bargained away by customers and suppliers. Another is lost because substitutes limit prices, or because investment is needed to keep entrants out (Porter, 2008).
Differences between industries are large and persistent. Between 1992 and 2006, average return on invested capital in US industries ranged from zero or less to more than 50%. Soft drinks and prepackaged software were almost six times more profitable than airlines over the period. Porter attributes the difference to structure, not to whether an industry is new or mature, high or low tech, regulated or not.
The five forces, one by one
The forces don’t carry the same weight in every industry. The strongest one sets profitability, and it isn’t always the most visible. In photographic film, for instance, the problem wasn’t rivalry among manufacturers, but the arrival of a superior substitute, digital photography.
Threat of new entrants
What limits profit is the threat, even if nobody enters. If entry is easy, companies hold prices down or invest more just to discourage outsiders. The force depends on the height of the barriers and on the reaction entrants expect from incumbents.
Porter lists seven barriers: supply-side economies of scale, demand-side benefits of scale (network effects), customer switching costs, capital requirements, incumbency advantages, unequal access to distribution channels and government policy.
Useful question: how much would a company with cash need to spend to be here in 18 months?
Power of suppliers
Strong suppliers capture value by charging more, limiting quality or shifting costs, and that includes labor. The damage is greatest when the industry can’t pass on the increase. They have power when they’re more concentrated than the industry, depend little on it, offer something differentiated or without a substitute, impose high switching costs or can start competing directly.
Useful question: if your main supplier doubled its price, how long would it take to replace it?
Power of buyers
This force has two parts, and it’s worth separating them. One is negotiating leverage: few buyers or large volumes, standardized products, low switching costs, a threat to produce in-house. The other is price sensitivity: a buyer pushes harder when the product weighs on its budget, when its own profits are low or when the product barely affects the quality of what it delivers. A customer can have power and not use it, if the product helps it earn more money.
Intermediaries count too. A channel that influences the end customer’s decision has bargaining power of its own.
Useful question: how much does your product weigh in the customer’s costs, and what happens to their business if it fails?
Threat of substitutes
A substitute performs the same function by different means: videoconferencing instead of travel, email instead of express mail. It limits the price the industry can charge, because above a certain point the customer switches solutions.
Substitutes are easy to ignore, because they don’t look like competitors. Buying used, doing it in-house and simply not buying count too. The threat grows when the substitute offers a good trade-off between price and performance and when switching costs little.
Useful question: how would the customer solve the problem if your entire industry disappeared?
Rivalry among competitors
Rivalry cuts profit according to its intensity and its basis. It’s more intense when there are many competitors or rivals of similar size, the industry grows slowly, exit is expensive and companies have goals beyond profit in that business.
The basis matters as much as the intensity. Price competition is the most destructive, because it transfers profit straight to the customer, it’s easy to copy and it teaches customers to look only at price. It’s more likely with nearly identical products, low switching costs, high fixed costs and perishable products. And an empty seat, a vacant room or an idle server hour are all perishable.
When everyone fights for the same customers on the same attributes, competition tends to be zero sum. When each company serves different needs, it can expand the industry and its average profitability.
Useful question: do your competitors fight for the same customer, for the same reason?
What isn’t a force
Porter calls attention to a common mistake: confusing an industry’s visible attributes with its structure.
- Growth. Growth eases rivalry, but it doesn’t guarantee profit. It can give suppliers power and, with low barriers, attract entrants.
- Technology. Being advanced doesn’t make an industry attractive. Simple industries with price-insensitive customers and high barriers can earn far more.
- Government. Regulation is neither good nor bad in itself. A patent raises barriers. Another rule may increase supplier power. Analyze each policy’s effect on the forces.
- Complements. These are products used together, like hardware and software. They can raise or lower barriers and make substitution easier or harder.
The same logic applies to generative AI. It isn’t a sixth force. The useful question is what it does to the five: does it lower entry barriers? Does it create a substitute for your service? Does it increase the power of whoever supplies the models?
The Five Forces aren’t SWOT
The two tools answer different questions:
| Tool | Looks at | Question |
|---|---|---|
| SWOT | The organization | What is our position? |
| Five Forces | The industry | Why is profitability what it is? |
They complement each other. The forces show the environment a company competes in, which helps fill in opportunities and threats more rigorously. Nor is the model a list of competitors: four of the five forces are about those who aren’t direct competitors.
When to use it and when to avoid it
When to use it
- Assessing entry into an industry or exit from it
- Understanding why margins are what they are
- Choosing where to position yourself within an industry
- Before an acquisition or a large investment
When to avoid it
- Comparing products or features
- Industries so new that even the participants aren't defined
- Short-term decisions tied to cycles or passing events
- Platforms, if the analysis ignores network effects
How to apply it
Porter suggests a sequence, summarized here:
- Define the industry. Decide which products and geography are in. If two offerings have different buyers, suppliers and barriers, treat them as separate industries.
- Identify the participants. List buyers, suppliers, competitors, substitutes and potential entrants, in groups when they differ from each other.
- Assess the mechanisms. State which forces are strong and why, with numbers when possible.
- Find the force that controls profit. Test the analysis: does it explain long-run average profitability? Are the most profitable companies better protected from the forces?
- Look at the movement. Analyze what is likely to change in each force, separating cycles from structural change.
- Turn it into a decision. Identify what can be influenced by your company, by competitors or by entrants.
For most industries, Porter suggests a horizon of three to five years, covering a full business cycle. What matters is average profitability over that period, not the figure for any particular year.
Worked example: a retail chain assesses a marketplace
A home goods retail chain is assessing whether to open a marketplace with third-party sellers. The industry under analysis is home goods marketplaces in the national market. The first pass gives each force a pressure level and records the confidence in each assessment:
| Force | Level | Confidence |
|---|---|---|
| Rivalry | High | High |
| Buyers | High | Medium |
| Suppliers | Medium | Low |
| New entrants | Medium | Medium |
| Substitutes | Medium | Low |
- Rivalry. Large platforms compete on price and shipping. The team confirmed this by tracking 200 items for eight weeks.
- Buyers. Consumers compare prices in seconds and pay nothing to switch stores.
- Suppliers. In a marketplace, the seller is a supplier of assortment and also a customer of the platform. Large sellers list in several places and can negotiate the commission. How many there are and how much they sell is still unknown.
- New entrants. Opening a site is easy, but building a base of sellers and buyers is expensive.
- Substitutes. Physical stores, brands’ own sites and used goods meet the same need. How much they weigh in the category still needs measuring.
It’s worth separating each role, so substitutes don’t get mixed up with competitors:
| Role | Example in this case |
|---|---|
| Direct competitor | Another marketplace |
| Substitute | Brand’s site, physical store, used goods |
| New entrant | Social network that starts selling |
| Complement | Payments and logistics |
From force to margin
Porter insists on looking at structure in numbers, because the forces show up in price, cost and investment. On each line, the question is “how much?”. For an average order of 200 currency units, with a 14% commission and subsidized shipping, the math looks like this:
| Item | Value | Force |
|---|---|---|
| Commission (14%) | +28 | Suppliers |
| Payments (3%) | −6 | Suppliers |
| Shipping | −8 | Rivalry |
| Support and fraud | −4 | Buyers |
| Marketing | −7 | Rivalry |
| Margin per order | +3 |
That leaves 1.5% of the order value, before technology and overhead. Now, a little pressure from each force:
- Large sellers negotiate the commission from 14% to 12%: the margin falls to −1.
- Competition forces 3 more units of shipping: the margin goes to zero.
- Marketing rises by 3 units per order: the margin goes to zero.
- All three together: the margin falls to −7.
This shows what the qualitative analysis hides: the force that controls profit is rivalry on price and shipping, and the margin is so thin that any move wipes it out.
What to do with this
The analysis doesn’t say “don’t enter”. Porter is explicit: the point isn’t to declare an industry attractive or not, but to understand the causes of profitability to make better choices. He points to three paths, and the classic example of the first is Paccar, a truck maker that focused on owner-operators, a less price-sensitive group, in an industry with large fleet buyers.
- Position where the forces are weakest. Instead of a general marketplace, focus on categories that require assembly or installation. There, physical stores and local service weigh more than price.
- Exploit change. If sellers are unhappy about depending on large platforms, offer an alternative with an exclusive assortment.
- Reshape the structure. Create services that make it harder for sellers to leave, such as integrated logistics, and private labels that reduce dependence on the large ones.
Each path is a hypothesis. The natural test is to measure the margin per order in one category with installation before opening the full marketplace.
Common mistakes
Porter lists several, and these show up most often:
- Defining the industry badly. Too broad hides differences. Too narrow misses connections.
- Making lists instead of analysis. “Rivalry: high” explains nothing without a mechanism and a number.
- Giving every force equal attention. Dig into the ones that control profit.
- Confusing effect with cause. Price sensitivity is an effect. The cause lies in the buyer’s economics.
- Confusing cycle with structure. One bad year doesn’t change the industry.
What the model doesn’t see
The model is influential, but it has known limits:
- Industry doesn’t explain everything. McGahan & Porter (1997) attributed 19% of the variance in profitability among US corporations to industry, 32% to business-specific effects, 4% to the corporate parent and 2% to the year, with the rest unexplained. Industry weighed less in manufacturing and more in services, retail and transportation. Earlier, Rumelt (1991) had already found business effects much larger than industry ones.
- Complements take a back seat. Authors such as Brandenburger and Nalebuff highlight the role of complements. Porter’s reply is that they aren’t a sixth force, because they act through the five.
- Platforms follow a different logic. Van Alstyne, Parker & Choudary (2016) argue that the model describes “pipeline” businesses, which produce and sell. On platforms, network effects create value, and customers and suppliers can be assets, not just threats. Porter treats network effects as an entry barrier, which doesn’t capture all of this.
- It’s a snapshot. Porter says structure is relatively stable but admits it can change abruptly. In fast-moving industries, the analysis ages quickly.
How to use an LLM
An LLM helps organize participants, suggest mechanisms and find substitutes the team hasn’t considered. The risk is that it produces a generic list, with “high rivalry” for any industry, or invents facts about real companies. Provide evidence and require a mechanism, a confidence level and the missing data for each force.
Apply Porter's Five Forces to the [define industry and geography]industry to support the decision [objective].Known competitors: [list].Customers, suppliers, channels and alternatives: [describe].Available evidence: [describe].
Analyze rivalry, new entrants, buyers, suppliers and substitutesseparately. For each force, state the mechanisms, evidence, confidencelevel and implications for profitability.Indicate which force most limits profit and why.
Highlight missing data, differentiation opportunities and verifiablestrategic decisions. Don't confuse substitutes with direct competitorsand don't invent information about real companies.
Expected output: a diagnosis of the competitive structure and its strategic implications.
Before trusting the answer:
- Require the mechanism. If the answer says “high” without explaining how the force cuts the margin, ask again.
- Ask for the math. Ask how much each force costs in price, cost or investment, and calculate it with your own data.
- Check the facts. Shares, prices and moves by real companies need a source.
- Sanitize the context. Margins, contracts and entry plans are sensitive data.
Combine it with other frameworks
- SWOT analysis: the forces ground opportunities and threats; SWOT assesses the company’s position.
- BCG Matrix: the forces explain why a market is attractive, something the growth rate doesn’t show.
- Blue Ocean Strategy: when the structure is hostile, it helps you look for other factors to compete on.
- Scenario planning: tests what would happen if the forces changed.
- Ansoff Matrix: maps growth paths once you understand the industry.
References
- Brandenburger, A. M. & Nalebuff, B. J. (1996). Co-opetition. Currency Doubleday.
- McGahan, A. M. & Porter, M. E. (1997). How Much Does Industry Matter, Really? Strategic Management Journal, 18(S1), 15–30. DOI
- Porter, M. E. (1979). How Competitive Forces Shape Strategy. Harvard Business Review, March–April. Link
- Porter, M. E. (2008). The Five Competitive Forces That Shape Strategy. Harvard Business Review, January. Link
- Rumelt, R. P. (1991). How much does industry matter? Strategic Management Journal, 12(3), 167–185. DOI
- Van Alstyne, M. W., Parker, G. G. & Choudary, S. P. (2016). Pipelines, Platforms, and the New Rules of Strategy. Harvard Business Review, April. Link