It’s 11 a.m., and the alert fires. Someone restarts the service. Someone else adds capacity. A third person rolls back the latest release. An hour later, three changes are live, nobody knows which one helped, and the problem was something else.
The team acted fast, but on a wrong reading. The OODA loop is often summed up as “decide faster than the others”, and that summary misses the main point: the speed that matters depends on how you interpret what’s happening.
What the OODA loop is
OODA stands for Observe, Orient, Decide, Act. The concept was developed by John Boyd, a US Air Force colonel, to think about combat operations, and was later taken into business, cybersecurity and management (Wikipedia).
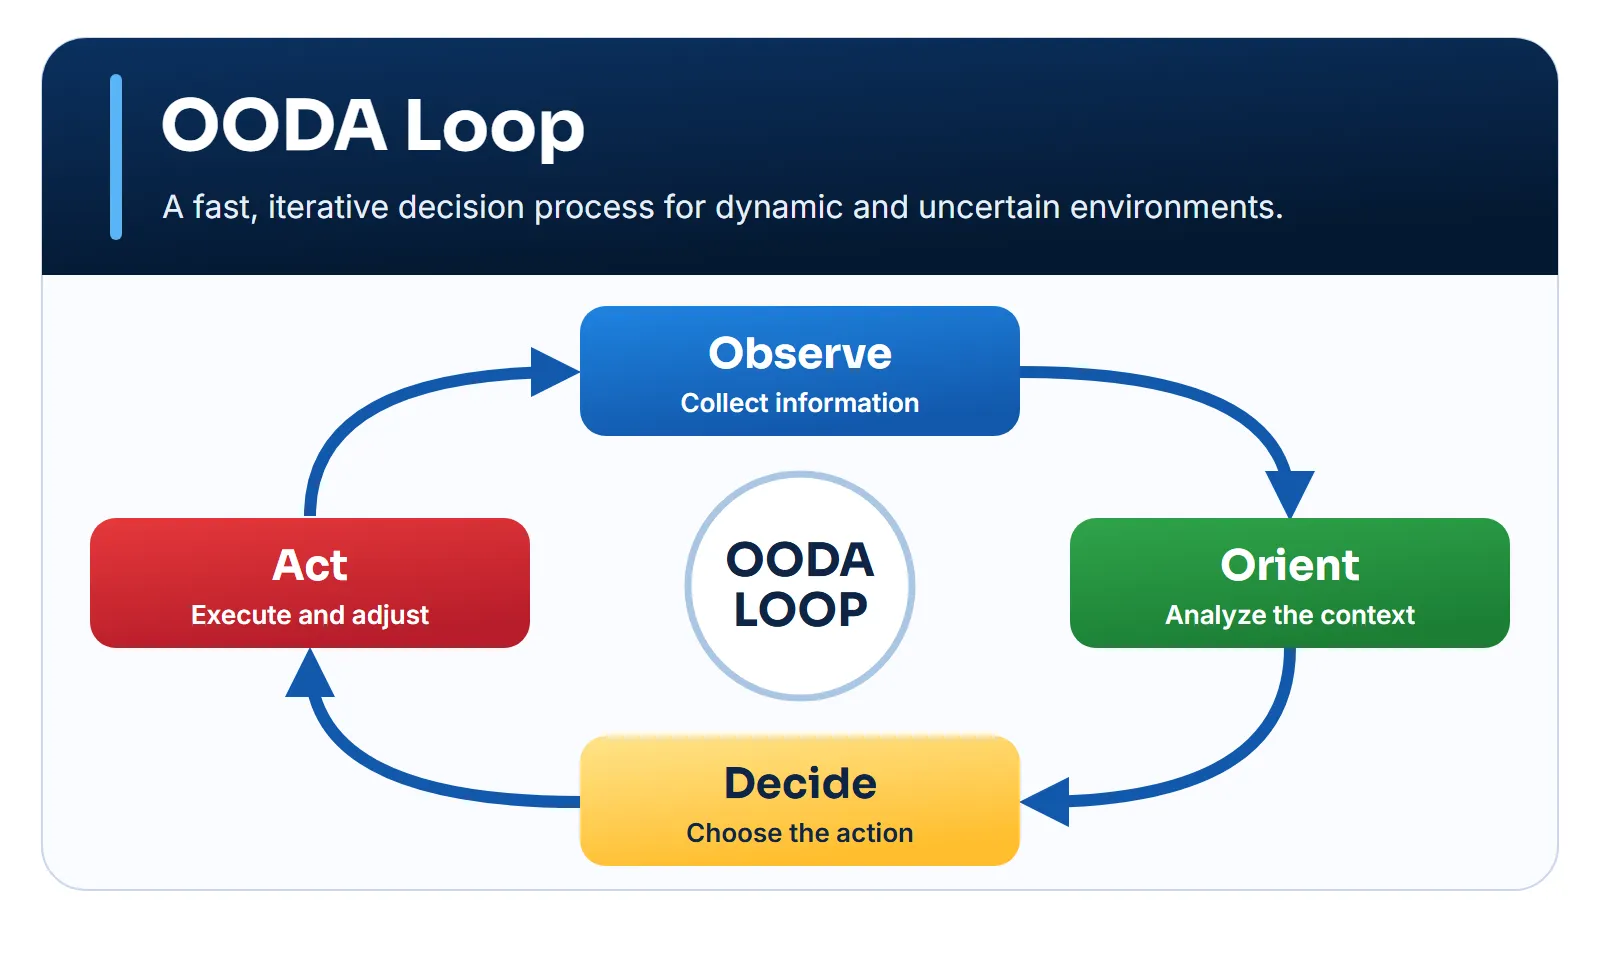
| Stage | Question | Error |
|---|---|---|
| Observe | What’s happening? | Watching only the usual dashboard |
| Orient | What does it mean? | Fitting it to existing beliefs |
| Decide | What will we try? | Seeking the perfect decision |
| Act | How do we test it? | Acting without measuring the effect |
Boyd’s loop isn’t a circle
The four-box version is handy to remember, but it oversimplifies. Boyd drew the loop in The Essence of Winning and Losing, a 1995 briefing (Marine Corps University archive). In his diagram, orientation is the focal point, and the arrows don’t run in a single direction (Strategy U):
- Orientation shapes observation. What you expect to see influences what you see. A team convinced the vendor is at fault looks at the vendor first.
- Orientation has components. Boyd cites cultural traditions, genetic heritage, previous experiences, new information, and analysis and synthesis. In short: no reading is neutral.
- There’s a direct path from orientation to action. Boyd called this implicit guidance and control. Someone who recognizes a well-trained pattern can act without a formal decision step.
- Action generates new observations. Every action is also a test, and the result feeds back into the loop.
This changes what “being fast” means. Frans Osinga’s book on Boyd argues that the common reading, that whoever completes the loop fastest wins, is incomplete (Osinga, 2007). Executing a wrong reading faster only gets you to the error sooner.
OODA isn’t PDCA
The plan-do-check-act cycle, PDCA, also goes around, but it starts from another premise. It serves to improve a process: there’s a plan, and the team compares the result against it. OODA starts from the idea that the situation may change before the plan is done, so it avoids committing too early to one reading.
When to use it and when to avoid it
When to use it
- Incidents and security operations
- Responding to competitors' moves
- Operational decisions with incomplete information
- Iterative product work in unstable conditions
When to avoid it
- Stable projects, where the critical path method fits better
- Irreversible choices with no time pressure
- When there's no reliable signal to observe
- As an excuse to always improvise
How to apply it
- Define the goal and the decision deadline. How soon must you act, and what happens if nothing is done?
- Observe fast signals. Separate what’s known from what’s missing. Prefer indicators that respond in minutes or hours.
- Write at least two readings. A single reading is a conclusion in disguise.
- Look for the signal that separates them. Ask what would differ if each reading were true.
- Choose the most reversible action that tests the reading. Set an owner, a metric and a limit.
- Agree on the turn-back trigger. Decide in advance what will make the team change course.
- Act and observe again. The loop only closes when the effect of the action is seen.
Worked example: the fix that became an incident
After activation fell from 40% to 30%, a SaaS product tested a fix: indexing data right after connection. In the A/B test, activation went from 30.2% to 34.5%. The team rolls out the fix to all accounts on Monday at 9 a.m. The same day, a marketing campaign starts.
7-day activation is a good metric for deciding, but it’s too slow for following a rollout. So the team tracks fast-response signals.
Cycle 1: Tuesday, 10 a.m.
Observe. The share of accounts completing their first generation within 24 hours fell from 52% to 41%. The wait in the indexing queue, at the 95th percentile, went from 4 to 55 minutes. Tickets about “assistant not responding” rose from 6 to 40 a day. One piece of data is missing: none of this is split by account size.
Orient. The first reaction in the room is “the test worked, so the problem is elsewhere”. That’s exactly the bias orientation needs to examine. The team writes three readings and the signal that tests each one:
| Reading | What tests it |
|---|---|
| The model vendor is unstable | Vendor latency |
| The campaign brought different accounts | Failures by account source |
| The queue can’t take the full volume | Wait by queue volume |
Vendor latency is normal, and campaign accounts fail as often as the others. The third reading remains. The test ran on half of the new accounts, and now it’s all of them, plus the campaign.
Decide. There are two reversible options: go back to 50% of accounts or double the indexing workers. The team tries the second, since it preserves the gain, and agrees on the trigger: if the wait isn’t under 10 minutes within two hours, go back to 50%.
Act. The on-call person makes the change without needing approval, because it’s within the expected cost limit.
Cycle 2: Tuesday, noon
Observe. The wait fell to 18 minutes for small accounts but stays above an hour for large ones. Indexing cost rose by 1.10 per account, above the 0.50 limit set in the test. The team now splits the data by size: 4% of accounts take up 70% of the indexing time.
Orient. The reading changes. The problem isn’t total capacity, but a few large accounts occupying the queue. More capacity would only make the system more expensive.
Decide. The agreed trigger has been hit, and the team honors it. The real solution is something else: create a separate queue for large accounts and show a message saying their data is being prepared. This changes what large customers expect, so it needs approval from a product owner.
Act. The rollout goes back to 50%, capacity returns to normal, and the separate queue goes live the same day.
Cycle 3: Wednesday, 10 a.m.
Observe. With the separate queue and the rollout back at 100%, the wait sits at 9 minutes, 24-hour completion returns to 50%, and the added cost stays at 0.42. Tickets fall.
Orient. The fix works, as long as the queue separates large accounts. The team adds this case to the test plan, because the A/B test didn’t have enough volume to show the problem.
Decide and act. The rollout stays at 100%. The next cycle is slower: the fix recovered about 4 of the 10 lost points, and the remaining 6 or so still need explaining.
What this case shows
- The second reading was worth more than the first action. The gain came from finding out the problem was different, not from executing faster.
- A reversible action made the error cheap. Doubling capacity didn’t solve it, but it cost two hours and taught something.
- The trigger protected the decision. Nobody had to debate whether the target had been met.
The same loop at another pace
Not every cycle lasts hours. Imagine a competitor launches an AI feature similar to one on your roadmap for next year. The automatic reaction is to copy it. In a cycle of weeks, the conversation changes:
- Observe. How many customers asked about the feature? Was any deal lost? The first week usually brings more noise than signal.
- Orient. The team separates three readings: the feature solves a real problem for your customers, it serves another audience or it’s just a demo. Your own strategy comes in here, because copying can pull the company away from what sets it apart.
- Decide. Instead of a six-month project, the team chooses a two-week test with ten customers who asked for something similar.
- Act. The test goes live with a usage metric and a date to revisit the decision.
The right pace depends on how much the situation changes as the team decides. In an incident, it’s minutes. In product work, weeks. The error is swapping the paces: treating a competitor’s launch as an incident, or an incident as planning.
Signs the loop is broken
- There’s action, but nobody measures the effect. The loop doesn’t close.
- There’s only one explanation. Nobody wrote another reading.
- The same surprises keep coming back. Orientation isn’t learning.
- Everything goes up for approval. The loop stalls on decisions that could be local.
- Everyone looks only at dashboards. Those who talk to customers or run the system are left out.
What can be automatic
The direct path between orientation and action has a practical translation: trained procedures and automation. They work when the reading is known and the action is safe.
| Decision | Who | Why |
|---|---|---|
| Roll back on a trigger | System | Reversible, clear rule |
| Scale up to a limit | On-call | Reversible, limited cost |
| Notify customers | Person | Affects trust |
| Delete data | Person, with approval | Irreversible |
The same logic applies to AI agents. An agent can observe and propose actions, but its orientation is the weakest link: it doesn’t know the system’s history or what changed outside the data. The less reversible the action, the more human oversight it calls for.
What’s known about the method
OODA comes from military theory and experience, not from experiments. This research found no studies showing that using the loop improves results in companies. Historian Michael Hankins goes further: he considers the concept vague enough for defenders and critics to see what they want in it, and describes it as not incorrect, but neither unique nor especially profound.
The criticism is fair. The practical value lies less in the loop itself and more in the habits it brings to mind: writing alternative readings, seeking signals that separate them and preferring reversible actions.
How to use an LLM
An LLM helps organize signals, suggest readings the team hasn’t considered and propose questions. It’s useful precisely in orientation, for challenging the first hypothesis. It can’t see the system, so it shouldn’t get the final word on the cause, and any action it suggests must go through whoever is accountable for it.
Facilitate an OODA loop for [dynamic situation].Goal: [result].Observed signals and sources: [data].Constraints and capabilities: [describe].Decision deadline: [describe].
Organize:1. OBSERVE: relevant and missing data;2. ORIENT: interpretations, biases, hypotheses and context;3. DECIDE: alternatives, criteria and a provisional choice;4. ACT: reversible action, owner and response metric.
Define which new signals will trigger the next loop, which decisionscan be automated and which require human oversight.
Expected output: an operational decision, a short-term action and reassessment triggers.
Before trusting the answer:
- Require competing readings. If only one comes back, ask for two more and the signal that separates each.
- Separate data from interpretation. Check that the model hasn’t turned an assumption into a fact.
- Test reversibility. Ask how to undo each action and how long that takes.
- Sanitize the context. Logs and incident reports often contain customer data and security details.
Combine it with other frameworks
- Hypothesis testing: provides the evidence that orients the next loop.
- Scenario planning: defines in advance which signals change the plan.
- 5 Whys: investigates the cause calmly, once the situation is stable.
- Pre-mortem analysis: anticipates failures and the procedures to respond to them.
- Critical path method: plans a known network of dependencies; OODA serves adaptive cycles in changing environments.
References
- Boyd, J. R. (1995). The Essence of Winning and Losing. Briefing. Marine Corps University archive
- Hankins, M. (2021). Flying Camelot. Cornell University Press.
- Osinga, F. P. B. (2007). Science, Strategy and War: The Strategic Theory of John Boyd. Routledge. Link
- Strategy U. OODA Loop. Link
- Wikipedia. OODA loop. Link