A software company approves its entry into a new country. The spreadsheet is carefully built: base revenue, 20% above in the good case, 20% below in the bad one. Eighteen months later, a law requires customer data to stay in the country, and the product’s architecture can’t do that.
None of the spreadsheet’s three cases got the math wrong. The problem is that all of them started from the same world, and the variable that changed wasn’t even in the spreadsheet. Scenario planning exists for this kind of error: not misjudging a number, but never having asked the right question.
What scenario planning is
A scenario is a coherent description of how the environment of a decision may evolve. The method builds a few futures that are quite different from each other and asks how each decision would fare in each one. The goal is to prepare the decision, not to guess which future will come.
Paul Schoemaker points to three characteristics that set scenarios apart from traditional planning tools: the narrative format, uncertainty treated across models rather than within one, and the breakdown of a complex future into discrete states (Schoemaker, 1993). The second is the most important. A spreadsheet treats uncertainty as a range around a number. Scenarios accept that the business model itself may change.
| Method | Question | Output |
|---|---|---|
| Forecast | What should happen? | The most likely path |
| Sensitivity | What if this number changes? | The effect of one variable |
| Scenarios | What if the world is different? | Decisions tested across futures |
Where the method comes from
The use of scenarios is usually credited to Herman Kahn, who wrote stories about the future in his work for the US military at RAND in the 1950s (Wikipedia). Its way into business runs through Royal Dutch/Shell.
In 1965, Shell adopted a computerized planning system. Executives realized that many of the company’s commitments went beyond the system’s six-year horizon, and that it got even the near term wrong. The system was shut down in the early 1970s (Wilkinson & Kupers, 2013). Pierre Wack and Edward Newland developed the company’s scenario system there, which Wack described in two Harvard Business Review articles in 1985.
The case became famous because a 1972 report warned that a barrel of oil could go from about 2 dollars to as much as 10, shortly before the oil shock (Kleiner, 2003). But the same account also has another side: Shell ignored several warnings from its own scenarios, and Wack concluded that they weren’t enough on their own to change managers’ mental models. That part of the story is the most useful for anyone applying the method. A good scenario that changes no decision has served no purpose.
Why optimistic, likely and pessimistic aren’t enough
This trio is the most common way of “doing scenarios”, and it has three problems:
- It’s the same world with other numbers. The variables are the same, and only their levels change. The data law from the opening would never appear.
- The middle one becomes the forecast. When a case is called “likely”, the team tends to plan on it and treat the others as decoration.
- It barely separates decisions. If the good case is the base case with more revenue, nearly every option looks good in it and bad in the worst case. The exercise doesn’t show which choice breaks, or why.
A simple test: if you can move from one scenario to another by changing a single number, you have a sensitivity analysis. It’s useful, but it’s a different tool.
Good scenarios are named after a situation, not a mood. And each should carry both good and bad news, because almost no future is bad for everyone. A heavy regulation, for example, hurts those trying to enter a market and protects those already in it.
When to use it and when to avoid it
When to use it
- Decisions that are costly to reverse, with effects over several years
- Expansion, technological change or uncertain regulation
- Heavy dependence on a supplier or a platform
- When the team agrees too much about what the future will look like
When to avoid it
- Small, reversible decisions, where a direct test is worth more
- Uncertainties a cheap experiment would settle
- When the decision is already made and only validation is sought
- In place of operational forecasting, such as the quarterly budget
How to apply it
- Define the decision and the horizon. “Do we enter this country in the next 36 months?” works better than “the future of the industry”. Without a decision, the exercise becomes a chat about trends.
- List the forces. Customers, technology, regulation, competition, the economy and suppliers. Include who might win or lose from each change.
- Separate trends from uncertainties. What’s already under way holds in every scenario. What can go in different directions is an uncertainty.
- Pick the two critical uncertainties. Look for high impact on the decision, low predictability and independence between the two.
- Build the matrix and write the stories. Each combination becomes a scenario, with a name, a cause and a plausible sequence of events.
- Test the decisions. Compare the options in each scenario and look for what holds up in all of them.
- Set signals and triggers. Choose indicators that move before the event, and agree on the action in advance.
- Schedule the review. Scenarios age. Set the date when they’ll be revisited.
The two-axis matrix in step 5 is a standard scenario-creation technique, associated with Peter Schwartz (Phadnis et al., 2015). The independence in step 4 is what makes it work: if two axes always move together, there’s really only one.
Worked example: a SaaS company decides on a new country
A contract management software company is evaluating entry into a new country over the next 36 months. There are three options: open its own operation, enter with a local partner or wait.
Trends, valid in every scenario: companies keep moving to the cloud, customers come to expect AI features, and tech salaries in the new country stay high.
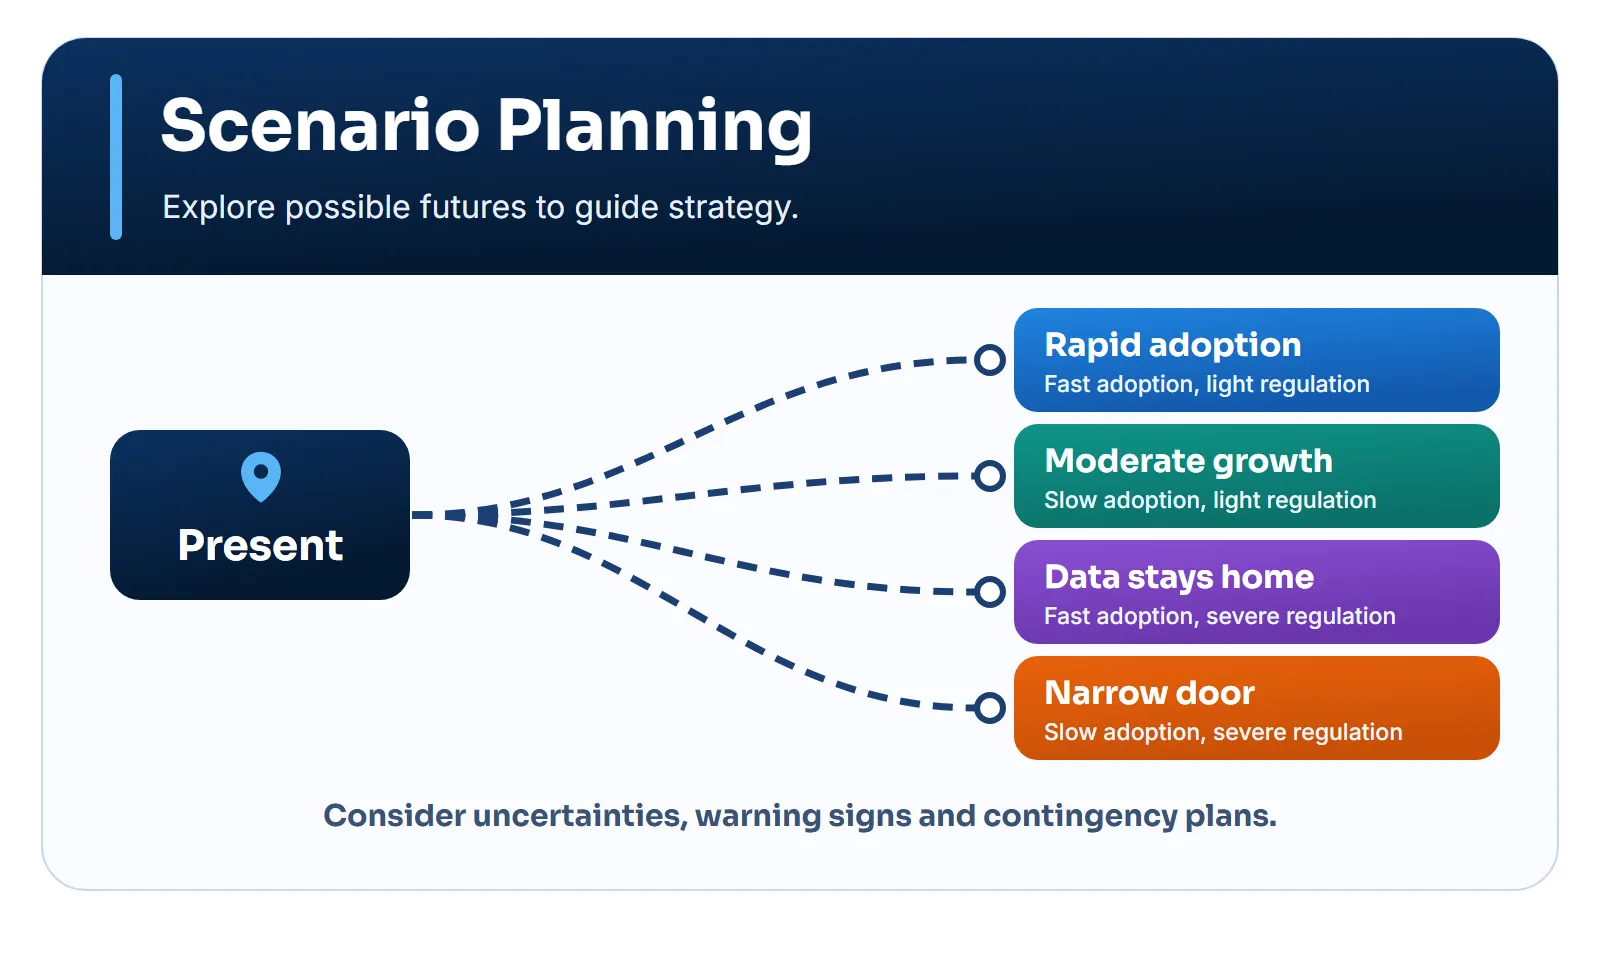
Uncertainties: how fast the category gets adopted, how strict data regulation becomes, whether a global competitor enters, and the exchange rate. The exchange rate changes the numbers but not the logic of the business, so it stays in the sensitivity analysis. The two critical ones are adoption and regulation, which can vary independently. In the matrix, rows show adoption and columns show regulation:
| Adoption | Light | Severe |
|---|---|---|
| Fast | Rapid adoption | Data stays home |
| Slow | Moderate growth | Narrow door |
Each combination becomes a story:
- Rapid adoption. Large companies replace spreadsheets with software, and the category has no leader yet. Early arrivals win the first reference customers, but global competition follows close behind.
- Moderate growth. Companies buy slowly, nearly always through integrators. The sales cycle is long, and margins depend on a lean team.
- Data stays home. Demand exists, but a law requires data to stay in the country. Those with local infrastructure win. Costs rise, and the barrier protects whoever is already there.
- Narrow door. Severe rules arrive before demand matures. A few certified vendors fight over a small market, and certification costs more than early revenue.
Note that none of these names is “good” or “bad”. “Data stays home” is a threat to those relying on infrastructure abroad and a shield for those who prepared.
Testing the decisions
The team estimates the value of each option in each scenario, in millions of currency units, over the 36 months. Waiting is worth zero, because it’s the reference:
| Scenario | Own | Partner | Wait |
|---|---|---|---|
| Rapid adoption | 18 | 11 | 0 |
| Moderate growth | 2 | 3 | 0 |
| Data stays home | 6 | 8 | 0 |
| Narrow door | −9 | −1 | 0 |
How do you compare without assigning probabilities? One way is to calculate regret: how much is lost by not having chosen the best option for that scenario. The criterion of minimizing the largest regret comes from decision theory (Savage, 1951).
- Regret of option o in scenario s
- Value of the best option in scenario s
- Value of option o in scenario s
In “Rapid adoption”, the best option is worth 18. The partner is worth 11, so its regret in that scenario is 7. Repeating the math for every cell:
| Scenario | Own | Partner | Wait |
|---|---|---|---|
| Rapid adoption | 0 | 7 | 18 |
| Moderate growth | 1 | 0 | 3 |
| Data stays home | 2 | 0 | 8 |
| Narrow door | 9 | 1 | 0 |
| Largest regret | 9 | 7 | 18 |
The table shows three things:
- Own operation has the largest gain and the largest loss. It’s a bet on rapid adoption.
- Partner gives up part of the gain in the best case, but never causes a large loss.
- Waiting looks like the safe option, because it never loses money. Yet it has the largest regret: the cost lies in what it fails to earn.
The gap between 7 and 9 is too small to decide on its own, since the numbers are estimates. What the table reveals is the shape of the risk, and that suggests a fourth option better than the first three: enter with the partner now and agree on the terms for taking over the operation later.
From scenario to plan
The final output is a plan in three parts:
- No-regret decisions, which pay off in any scenario: letting the product host data by region, adapting contracts and interviewing twenty potential customers.
- Options to keep open: a partner contract that allows for taking over the operation.
- Conditional bets: the own operation happens only if the signals call for it.
The signals must be leading indicators, meaning they have to move before the event that matters. Each comes with its action already agreed, so the team doesn’t have to reopen the debate when it appears:
| Signal | Trigger | Action |
|---|---|---|
| Proposals asking for local data | 3 in every 10 | Contract local hosting |
| Data bill | Passes committee | Review the plan with legal |
| Qualified leads | 200 a quarter, twice | Open own operation |
| Average sales cycle | Over 9 months | Keep only the partner |
What the evidence shows
The method is widely used but has been little tested. Phadnis and colleagues point out how few rigorous studies exist on its effect on expert judgment, and part of what’s said about it comes from cases like Shell’s, reported by those who took part in the work. A single case doesn’t prove the method caused the result.
The available studies suggest effects more modest than its reputation:
- Confidence. Schoemaker tested the effect of scenarios on people’s confidence ranges in experiments. He suggests the psychological benefit comes from using one bias against another: the conjunction fallacy against overconfidence.
- Expert judgment. Phadnis et al. (2015) ran three field experiments on long-range investments in transportation infrastructure. Contrary to past findings, scenarios didn’t raise or lower confidence in aggregate. Judgment shifted according to how the investment fared in each scenario.
- Flexibility. In the same study, experts came to prefer more flexible options. In one of the experiments, support for a more flexible option rose from 12.3% to 23.1%, although the least flexible option remained the most chosen.
- Results. A systematic review presented at a conference found general support for the method’s benefits, but also studies with no effect or an adverse one, and subjective and objective measures that sometimes conflict.
The prudent conclusion is that scenarios help people think differently and value flexibility. That’s useful, but it isn’t proof that they improve a company’s results.
How to use an LLM
An LLM is good for widening the list of forces, suggesting combinations the team hasn’t considered and drafting a first version of the narratives. Its weak points are a tendency toward conventional wisdom and the ease with which it writes convincing stories about anything. Give it the decision and the context, and ask for hypotheses, not facts about the future.
Help build strategic scenarios for [decision] over a[12/24/36-month] horizon.Known trends: [list].Critical uncertainties: [list].Resources and constraints: [describe].
Produce three or four plausible, internally coherent scenarios, notjust numerical optimistic/average/pessimistic versions. Give eachscenario a name that describes the situation. For each one, presentassumptions, possible events, risks, opportunities, warning indicatorsand low-regret decisions.
State which signals would require revisiting the strategy. Don't assignprobabilities without adequate data.
Expected output: scenario narratives, indicators and contingent decisions.
Before trusting the answer:
- Test the coherence. Ask which event would make each story stop making sense, and look for contradictions between assumptions.
- Check the facts. Laws, numbers and trends cited by the model need a source. Treat any figure as a hypothesis until verified.
- Look for what’s missing. Ask for the scenario your team would rather not discuss, and compare it with the original list.
- Sanitize the context. Expansion plans and internal numbers shouldn’t go into public tools.
Combine it with other frameworks
- Porter’s Five Forces: shows what sustains the industry’s profitability and which changes deserve to become critical uncertainties.
- Cost-benefit analysis: gives the value of each option in each scenario.
- Decision matrix: compares options when there are criteria beyond money.
- Pre-mortem analysis: scenarios explore the environment; the pre-mortem assumes the plan failed and looks for the reason.
- OODA loop: helps you act when the signals appear.
References
- Kleiner, A. (2003). The Man Who Saw the Future. strategy+business, 30. Link
- Phadnis, S., Caplice, C., Sheffi, Y. & Singh, M. (2015). Effect of scenario planning on field experts’ judgment of long-range investment decisions. Strategic Management Journal, 36(9), 1401–1411. DOI
- Gökmen, G. & McKiernan, P. (2021). Towards a theory of effective scenario planning: A systematic review and critical interpretive synthesis. European Academy of Management Conference. Link
- Savage, L. J. (1951). The Theory of Statistical Decision. Journal of the American Statistical Association, 46(253), 55–67. DOI
- Schoemaker, P. J. H. (1993). Multiple scenario development: Its conceptual and behavioral foundation. Strategic Management Journal, 14(3), 193–213. DOI
- Schwartz, P. (1991). The Art of the Long View. Doubleday.
- Tversky, A. & Kahneman, D. (1983). Extensional versus intuitive reasoning: The conjunction fallacy in probability judgment. Psychological Review, 90(4), 293–315. DOI
- Wack, P. (1985). Scenarios: Uncharted Waters Ahead. Harvard Business Review, September–October. Link
- Wack, P. (1985). Scenarios: Shooting the Rapids. Harvard Business Review, November–December. Link
- Wikipedia. Scenario planning. Link
- Wilkinson, A. & Kupers, R. (2013). Living in the Futures. Harvard Business Review, May. Link