The year’s goal is growth. In the meeting, sales wants to open a new country, product wants an AI module and someone suggests entering another sector. All three ideas answer the same goal, but they call for very different capabilities, investments and risks, and the conversation turns into a contest of preferences.
The Ansoff Matrix organizes that discussion. It doesn’t say which path to take, but it forces you to say what kind of growth you’re talking about, and what that kind requires.
What the Ansoff Matrix is
The matrix combines two questions: is the product existing or new? Is the market existing or new? Crossing them produces four paths.
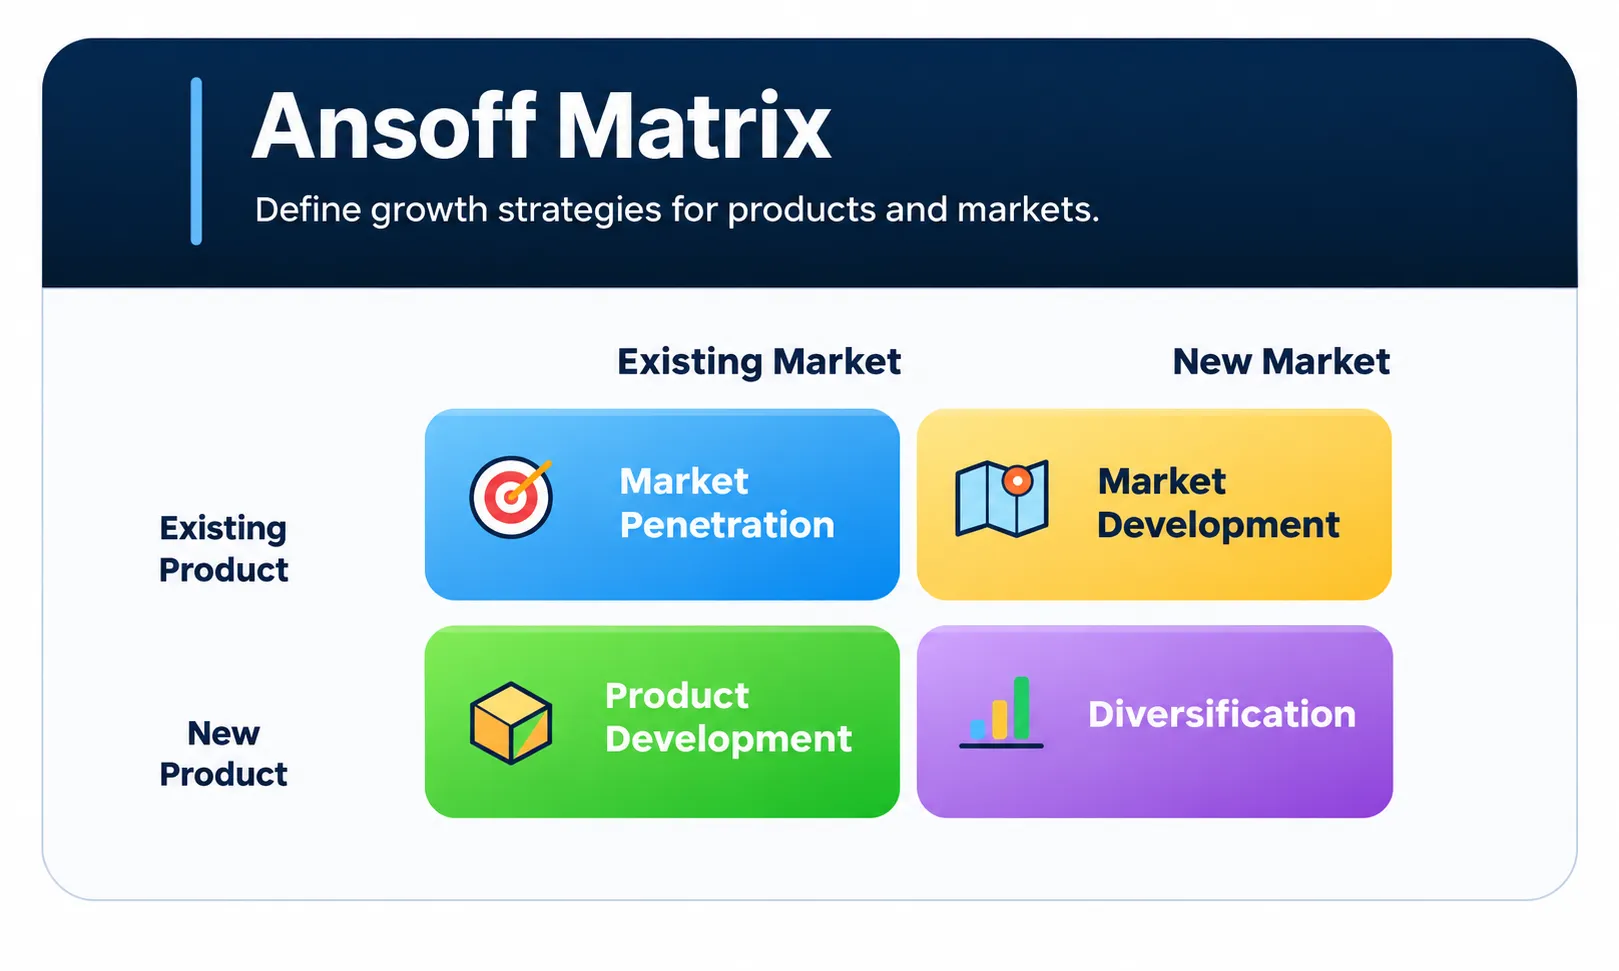
| Path | Central question |
|---|---|
| Market penetration | How do we sell more of what we have to those we already serve? |
| Market development | Who else does this product solve a problem for? |
| Product development | What else do our customers need? |
| Diversification | What capabilities do we take to a different business? |
The matrix comes from H. Igor Ansoff, who presented it in the article Strategies for Diversification, in the Harvard Business Review, in 1957, and returned to it in the 1965 book Corporate Strategy.
What “new” means
This is the most important definition, and it usually stays implicit. New is always relative to the organization, not the world. An AI module may be common in the sector and entirely new to your company, because it requires data, quality evaluation and inference costs it has never dealt with.
“Market”, for its part, isn’t just geography. A new segment, a new customer size or a new channel can count. A simple test helps: do we already have the customers, channel and knowledge to serve this market? If the answer is no, it’s new.
Where the risk lies
Each step away from what the company knows adds different uncertainties:
- Penetration: saturation limits and competitors’ reactions.
- Market development: fit with the new audience, channel, regulation and support.
- Product development: technical execution and adoption.
- Diversification: adds both sources of uncertainty, because product and market are unknown at the same time.
The order is a tendency, not a law. Penetrating a saturated market can be riskier than entering a neighboring segment whose customers have the same problem.
When to use it and when to avoid it
When to use it
- Annual planning and setting growth goals
- To organize competing expansion ideas
- Expanding a SaaS offering into new segments
- To make clear what each path demands of the company
When to avoid it
- To assess an industry's attractiveness: use the Five Forces
- To decide what to keep in a portfolio: use the BCG Matrix
- When the problem is retention or quality, not growth
- As a substitute for market and customer data
How to apply it
- Describe the starting point. List current products, markets, channels and capabilities.
- Set the goal and the limits. Write down the growth objective and the financial, regulatory and operational constraints.
- Generate options for all four quadrants. Even those that seem unlikely. This avoids discussing only what was already in the group’s head.
- Assess each option. Consider audience, resources, main risk and dependencies.
- Define an experiment and an indicator. Before investing, work out what would have to be true and test it the cheapest way.
Example: a financial SaaS wants to grow
A financial management SaaS for small businesses wants to increase revenue. The team generates one option per quadrant:
| Path | Option | Experiment | Indicator |
|---|---|---|---|
| Penetration | Annual plan and referrals | Offer to part of the base | Expansion revenue |
| Market | Another country | Interviews and sign-up page | Qualified interest |
| Product | AI module | Beta with current customers | Recurring use |
| Diversification | Clinic management | Pre-sale with a partner | Signed contracts |
The comparison shows what each option asks for. The annual plan uses everything that exists, but it has a ceiling. The new country keeps the product and changes taxes, currency and support. The AI module uses the current channel, but brings new costs and quality risks. Clinic management requires another product and another kind of sale at the same time.
With capacity for two fronts, the team could move ahead with penetration, which pays back fastest, and with the module beta, which learns from the current base. The new country becomes a low-cost test, and clinics stay on record with the condition that would bring them back to the table.
How to use an LLM
An LLM helps generate options for forgotten quadrants, list dependencies and suggest cheap experiments. It doesn’t know the real size of your market or your capabilities, and it tends to fill data gaps with generalities. Treat market numbers as hypotheses until you confirm the source.
Act as a growth consultant and apply the Ansoff Matrix.Current product: [describe].Current markets and segments: [describe].Internal capabilities: [describe].Financial, regulatory and operational limits: [describe].
Define what counts as "new" for this organization. Generate alternativesfor all four quadrants. For each one, explain the audience, valueproposition, required resources, main risk, dependencies, initialexperiment and success indicator.
Compare the options without assuming diversification is always the beststrategy, or that penetration is always the safest. Don't invent marketsizes. If data is missing, say which.
Expected output: four comparable paths, each with its hypotheses and an initial experiment.
Before trusting the answer:
- Check the numbers. Market size and growth need a source.
- Test the definition of new. See whether the model considered your real capabilities, not those of a generic company.
- Cut expensive experiments. A test that requires building the product isn’t an initial experiment.
- Sanitize the context. Expansion plans are usually confidential.
Combine it with other frameworks
- BCG Matrix: Ansoff maps growth options, while BCG analyzes the portfolio by market growth and relative share.
- Porter’s Five Forces: assesses whether the new market is attractive before entering.
- Decision matrix: compares the paths with explicit criteria and weights.
- Hypothesis testing: turns each path’s assumption into an experiment.
References
- Ansoff, H. I. (1957). Strategies for Diversification. Harvard Business Review, 35(5), 113–124.
- Ansoff, H. I. (1965). Corporate Strategy.