A company has twelve apps and a budget for five. Each team comes to the meeting with good arguments, and the newest one usually looks the most promising. Without a shared criterion, money tends to follow history, or whoever speaks best.
The BCG Matrix offers a shared language for that conversation, and also a trap: it’s far too easy to glance at a label and decide. This article shows how to do the math correctly and why it should open the discussion, not close it.
What the BCG Matrix is
The matrix, also called the growth-share matrix, was popularized by Bruce Henderson, founder of the Boston Consulting Group, in the 1970 essay The Product Portfolio. It places each offering on a plane with two axes: the market growth rate and relative market share.
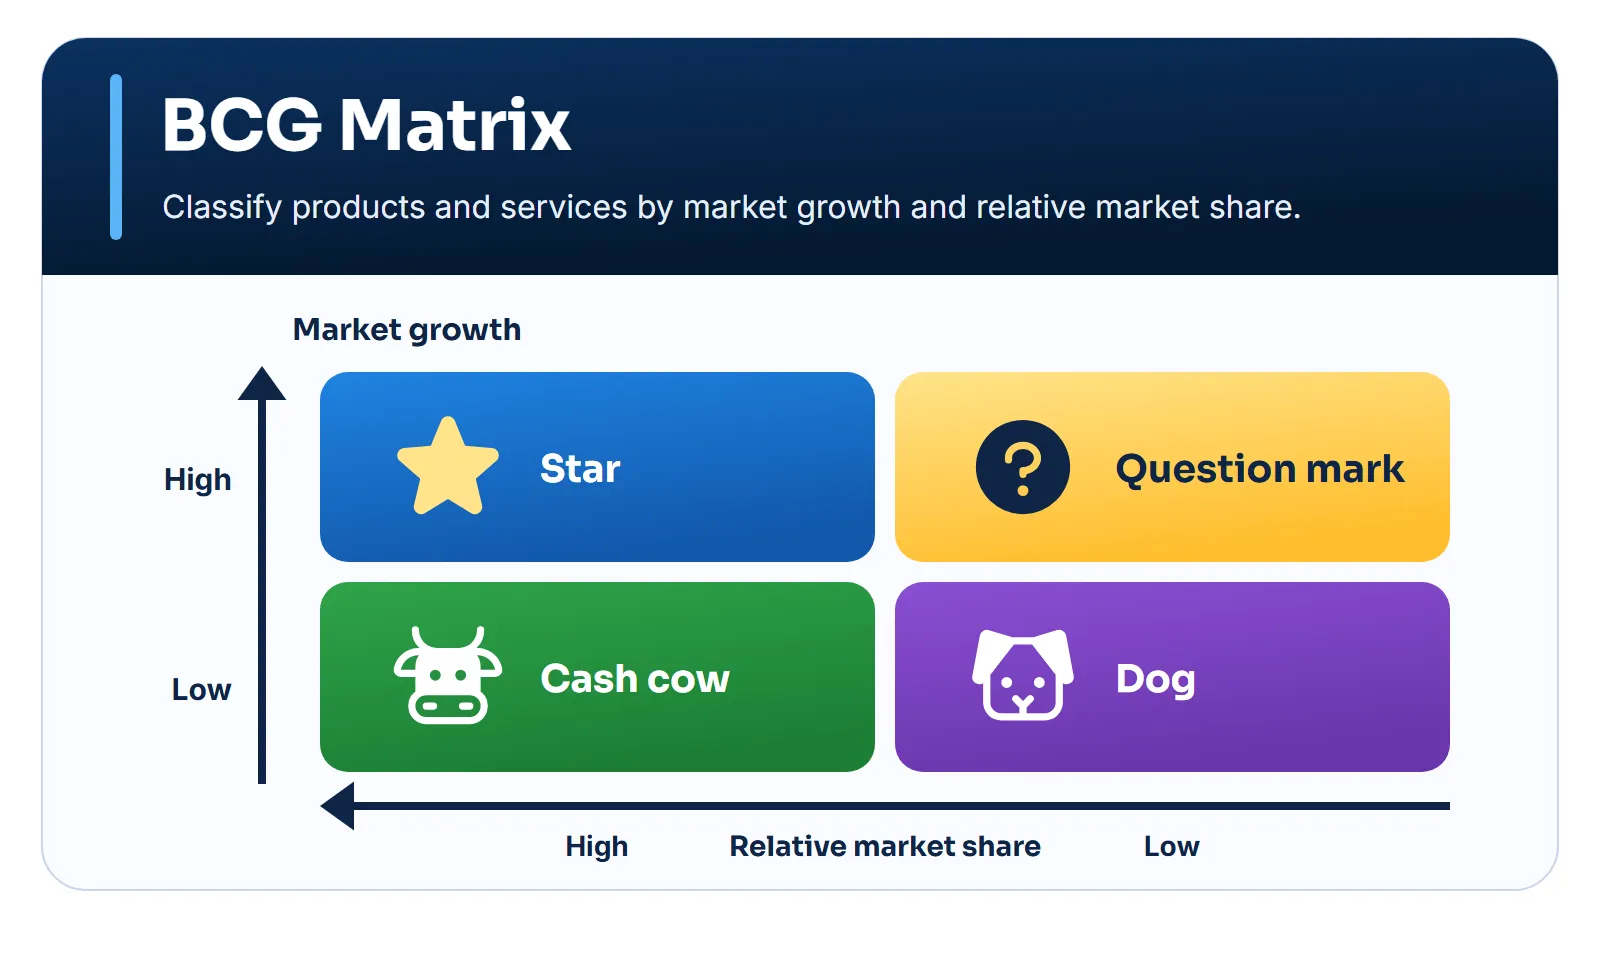
Henderson’s logic is about cash (Henderson, 1970):
- Cash cows have high share in slow markets. They generate more cash than they need, and that surplus funds the rest.
- Stars have high share in fast markets. They may be profitable, but they don’t always fund their own growth. If they keep the lead, they become cash cows when the market slows.
- Question marks have low share in fast markets. They consume a lot of cash and, without winning leadership, become a liability.
- Dogs have low share in slow markets. In the original essay, they’re called pets, and the name dogs came later.
These names are categories in a model. It’s best not to use them as a verdict on a product or the team working on it.
The calculation behind the axis
The horizontal axis is the matrix’s most misunderstood point. It doesn’t show your slice of the market, but your slice compared with that of a reference competitor:
- Relative market share
- Our market share
- The reference competitor's share: the largest competitor or, if the company leads, the runner-up
A value above 1 means the offering leads the market. Below 1, someone is ahead.
When to use it and when to avoid it
When to use it
- Companies with several offerings competing for the same budget
- To start the conversation about investing, holding or discontinuing
- When reliable market data exists
- To show where cash comes from and where it goes
When to avoid it
- With a single offering, or in a startup with no portfolio
- When the relevant market can't be defined
- When the offerings depend on each other
- As the sole criterion for ending a product
How to apply it
- Define the offering and the relevant market. This choice changes everything: in a niche you may lead; in the broad market, you may be irrelevant.
- Collect the data. Market growth, your share and the reference competitor’s, with sources.
- Calculate relative share. Use the formula above.
- State the thresholds. Write down what counts as high growth and high share.
- Position and discuss. Add margin, maintenance cost and dependencies before recommending.
Example: six apps, one budget
First, relative share:
| Offering | Ours | Reference | Relative |
|---|---|---|---|
| Accounting | 40% | 20% | 2.0 |
| Scheduling | 30% | 20% | 1.5 |
| AI automation | 5% | 25% | 0.2 |
| Invoicing | 30% | 45% | 0.67 |
| Payroll | 8% | 32% | 0.25 |
| Time tracking | No data | No data | No data |
Then, the cross with market growth:
| Offering | Quadrant | Market | Relative |
|---|---|---|---|
| Accounting | Cash cow | +3% | 2.0 |
| Scheduling | Star | +18% | 1.5 |
| AI automation | Question mark | +35% | 0.2 |
| Invoicing | Dog | +4% | 0.67 |
| Payroll | Dog | +2% | 0.25 |
| Time tracking | Unclassified | +12% | No data |
Three readings matter more than the labels:
- Same share, opposite positions. Scheduling and invoicing both hold 30% of their market, but one leads and the other chases a competitor with 45%. Absolute share would hide that.
- A dog can support another product. If accounting customers also use invoicing, ending the latter may hurt the main source of cash. The matrix doesn’t show that dependency.
- A question mark demands a decision. AI automation sits in a fast market with little share. By Henderson’s logic, it either gets investment to pursue leadership or should exit.
Time tracking stays out until there’s data, because classifying it without data would only produce the appearance of analysis.
What the evidence shows
The matrix was hugely influential: at its peak, it or derived methods were used by about half of Fortune 500 companies, according to estimates cited by BCG itself. But influence isn’t proof of effectiveness.
Armstrong & Brodie (1994) tested this in experiments with 1,015 participants acting as managers, who chose between investments that would either double the capital or lose half of it. Among those exposed to the matrix, 64% chose the unprofitable investment. Among those who used it in their analysis, 87% chose the less profitable one. The authors conclude that information about the matrix increased the likelihood of choosing the clearly worse project.
BCG itself revisited the method in 2014. Reeves, Moose & Venema show that businesses move through the quadrants faster: in 75% of industries, the average time in each fell from about four years in 1992 to under two in 2012. They also point out that the link between share and performance has weakened, and recommend more frequent reviews and more experimentation.
How to use an LLM
An LLM helps organize data, do the math and suggest questions about each offering. It doesn’t have your market data, and shares cited from memory are often wrong or outdated. Provide the numbers and require that offerings without data stay unclassified.
Analyze my portfolio using the BCG Matrix.Offerings: [list].For each offering, provide if available: revenue, relevant market,growth of that market, our share and the largest competitor's share,margins and maintenance cost.
Classify only items with sufficient data. Explain how relative sharewas calculated (our share divided by the reference competitor's share)and which thresholds were used. For the rest, record "insufficient data".
After classifying, consider margins and dependencies between offerings.Suggest actions, hypotheses to test and the risks of each allocationdecision. Don't treat the quadrant names as an automatic recommendation.
Expected output: a well-founded portfolio map and conditional recommendations.
Before trusting the answer:
- Redo the math. Confirm each relative share.
- Question the chosen market. Ask how the classification would change with a broader or narrower definition.
- Look for dependencies. Check what happens to the other offerings if one is discontinued.
- Sanitize the context. Revenue and margin by product are sensitive data.
Combine it with other frameworks
- Ansoff Matrix: BCG analyzes the current portfolio, while Ansoff maps growth paths.
- Porter’s Five Forces: explains why a market is attractive or not, something the growth rate doesn’t show.
- Cost-benefit analysis: assesses in money terms the decision to invest, hold or discontinue.
References
- Henderson, B. (1970). The Product Portfolio. Boston Consulting Group. Link
- Armstrong, J. S. & Brodie, R. J. (1994). Effects of portfolio planning methods on decision making: Experimental results. International Journal of Research in Marketing, 11(1), 73–84. DOI
- Reeves, M., Moose, S. & Venema, T. (2014). BCG Classics Revisited: The Growth Share Matrix. Boston Consulting Group. Link