Three vendors, five people in the meeting, each defending an option for a different reason. Someone suggests building a spreadsheet. Two hours later, the screen shows 8.1 against 7.3, and the conversation ends, because now there’s a number.
That’s both the risk and the value of a decision matrix. Used well, it forces the group to say what matters, how much it matters and on what basis. Used badly, it gives an appearance of precision to opinions that are still opinions. The difference lies in how criteria are separated, how scales are defined and what happens after the calculation.
What it is
A weighted decision matrix compares alternatives through explicit criteria. Each criterion gets a weight, each alternative gets a score on each criterion, and the total is the sum of the weighted scores.
- Total score of alternative j
- Weight of criterion i
- Score of alternative j on criterion i
- Number of criteria
The technique is usually associated with Stuart Pugh, who described concept selection in engineering in the early 1980s (Pugh, 1981). In its classic form, the Pugh matrix compares each concept with a reference using better, worse or same signs. Versions with weights and numeric scores are later adaptations. The calculation itself is an additive value model, the most widely used in multi-objective analyses (Parnell & Trainor, 2009).
Why does such a simple model help? Dawes (1979) showed that simple linear models, even with non-optimized weights such as equal weights, outperform clinical judgment when predicting a numerical criterion from numerical predictors. The study is about prediction, not vendor selection, but it suggests something useful here: much of the gain comes from choosing good criteria and applying them consistently, not from refining the second decimal place of the weights.
When to use it and when to avoid it
When to use it
- Choosing a vendor, platform, cloud service or architecture
- Selecting projects with limited resources
- Group decisions, with several areas and different priorities
- When the choice has to be explained or audited later
When to avoid it
- When a single criterion decides everything, such as a legal requirement
- When there is no evidence to score with and the numbers would be guesses
- When the decision is already made and the spreadsheet would only justify it
- To organize the day's tasks: the Eisenhower Matrix fits better
How to build it, step by step
- Define the decision and the alternatives. Include doing nothing or keeping the current solution, when that’s a real option.
- Separate the elimination criteria. Cut whatever doesn’t meet the minimum before scoring.
- Choose the compensatory criteria. Prefer a few criteria, independent of each other and tied to the objective.
- Define the scale and its anchors. Describe what each score range means.
- Set the weights. Consider the criterion’s importance and the real difference between the options.
- Score with evidence. Record the source of each score and flag what is an estimate.
- Calculate and test sensitivity. Vary weights and scores before recommending.
Elimination and compensatory criteria
In an additive model, a high score on one criterion offsets a low score on another. That’s useful for cost and schedule, but dangerous for requirements that allow no trade-off. A cheap, fast option shouldn’t win if it fails a security requirement.
The solution is to separate the two, as Kepner-Tregoe decision analysis does. MUST objectives are mandatory minimums, and WANT objectives compare the alternatives that remain. In the firm’s own words, the MUSTs decide who gets to play, but the WANTs decide who wins (Kepner-Tregoe).
Legal requirements, security requirements and budget ceilings are usually elimination criteria. Anything negotiable goes in as compensatory.
Scales and anchors
Without anchors, one person’s 7 is another person’s 9. The scale has to say what each score means, and a high score must always mean “more favorable”. For cost, then, a high score means cheaper.
| Score | Total cost over three years (example) |
|---|---|
| 9 to 10 | At least 20% below the budget ceiling |
| 7 to 8 | Between 10% and 20% below the ceiling |
| 5 to 6 | Up to 10% below the ceiling |
| 1 to 4 | At the ceiling, with little margin |
Criteria with no natural unit, such as ease of use, also need observable anchors. For example: “9 means a new user completed the main task unaided in the test”.
Weight depends on range
This is the matrix’s subtlest mistake. The question “which criterion is more important?” sounds right, but it’s incomplete. A weight reflects how much it matters to go from the worst to the best value of that criterion, so it only has meaning relative to the range considered (Monat, 2009).
If every option costs about the same, cost can matter a lot to the company and still barely differentiate this decision. Giving it 40% only adds noise.
Swing weighting addresses this. Instead of asking what is more important in the abstract, ask: if I could move one criterion from the worst to the best value observed among the options, which would bring the greatest gain? The swing weight matrix by Parnell & Trainor (2009) explicitly considers importance and variation when assigning weights.
Worked example: choosing an AI customer service platform
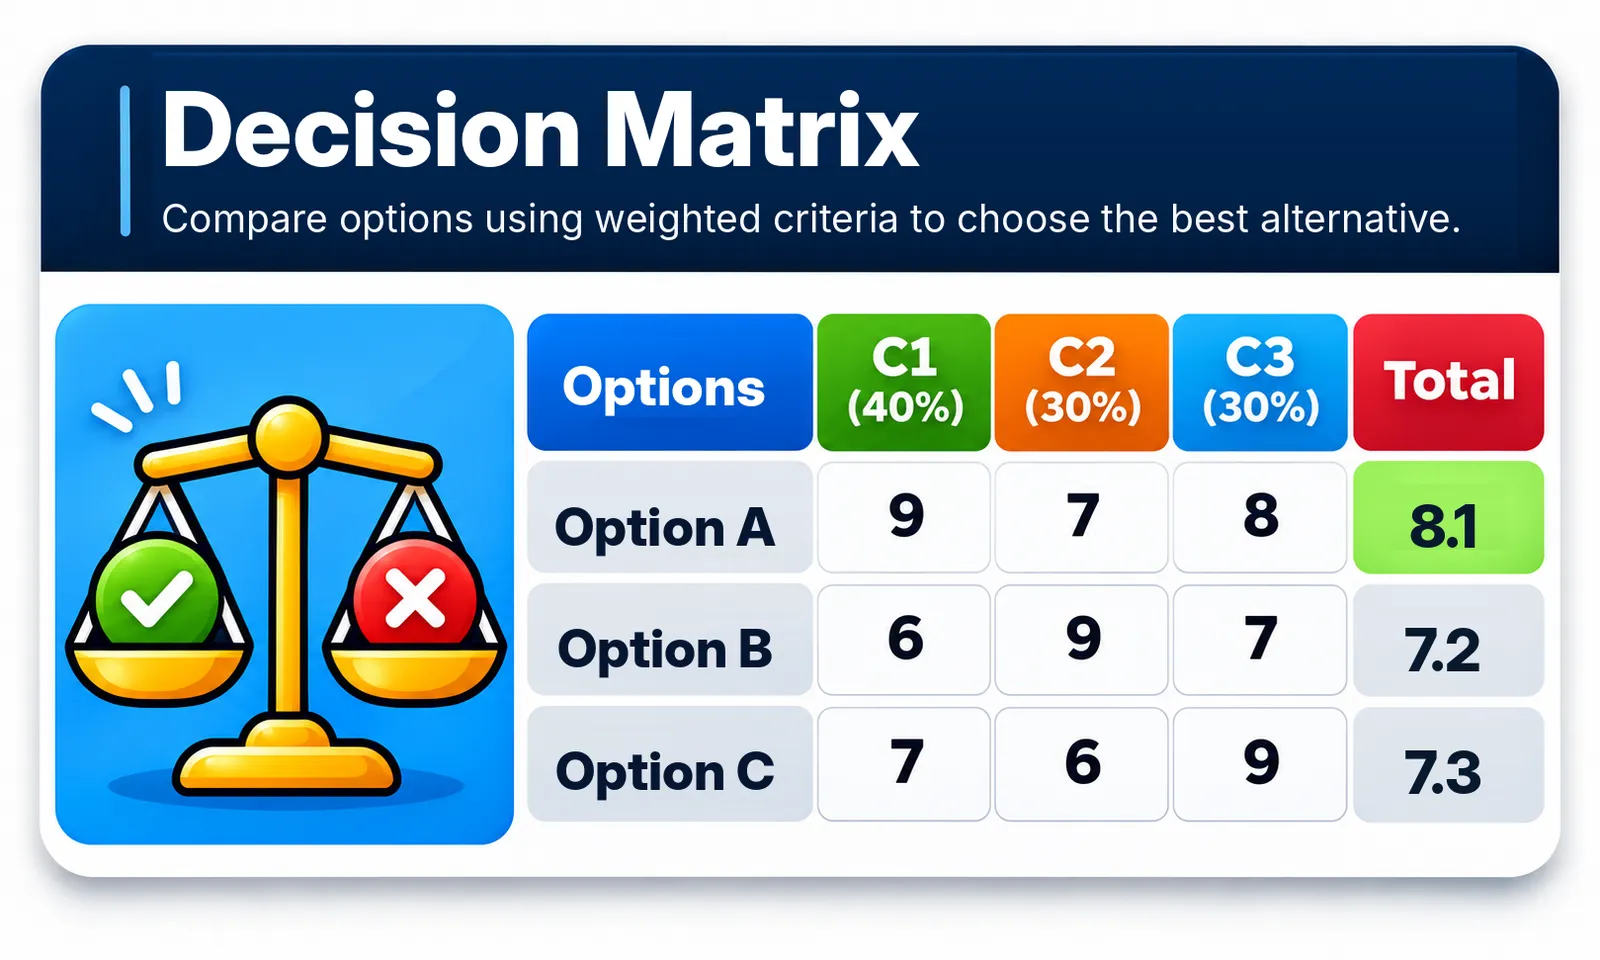
A company is about to buy an AI customer service platform and has received four proposals. The elimination criteria are a data processing agreement that complies with privacy law and integration with the current system. Option D doesn’t offer the required agreement and leaves before scoring, and no low price can make up for that.
Three options remain, assessed on three criteria: C1 is technical quality, C2 is total cost and C3 is implementation time. A high score always means more favorable.
| Option | C1 (40%) | C2 (30%) | C3 (30%) | Total |
|---|---|---|---|---|
| A | 9 | 7 | 8 | 8.1 |
| B | 6 | 9 | 7 | 7.2 |
| C | 7 | 6 | 9 | 7.3 |
The calculation for option A:
The sums for B () and C () follow the same logic. Option A leads, but that’s not yet the result of the analysis.
Sensitivity to weights
Weights are judgments, so the first question is whether another reasonable combination would change the answer.
| Weights (C1 / C2 / C3) | A | B | C | Winner |
|---|---|---|---|---|
| 40 / 30 / 30 (base) | 8.1 | 7.2 | 7.3 | A |
| 30 / 40 / 30 (cost weighs more) | 7.9 | 7.5 | 7.2 | A |
| 30 / 30 / 40 (time weighs more) | 8.0 | 7.3 | 7.5 | A |
| Equal weights | 8.0 | 7.3 | 7.3 | A |
| 20 / 50 / 30 (cost dominates) | 7.7 | 7.8 | 7.1 | B, by 0.1 |
Option A withstands moderate changes. Only when cost reaches half of the decision does option B move ahead, and by a small margin. If the board really thinks that way, it’s worth making explicit, because the decision is then about priorities, not vendors.
You can widen the test by sampling thousands of weight combinations around the base. With 10,000 samples, option A wins about 90% of the time, B 8% and C 2%:
import numpy as np
alternatives = ["A", "B", "C"]scores = np.array([[9, 7, 8], [6, 9, 7], [7, 6, 9]], dtype=float)
def totals(weights):    weights = np.asarray(weights, dtype=float)    return dict(zip(alternatives, np.round(scores @ (weights / weights.sum()), 2).tolist()))
print(totals([40, 30, 30]))  # {'A': 8.1, 'B': 7.2, 'C': 7.3}print(totals([20, 50, 30]))  # {'A': 7.7, 'B': 7.8, 'C': 7.1}
# Sample weights around the base and count how often each option wins.rng = np.random.default_rng(42)samples = rng.dirichlet([4, 3, 3], size=10_000)winners = (scores @ samples.T).argmax(axis=0)print({a: round(float((winners == i).mean()), 3) for i, a in enumerate(alternatives)})# {'A': 0.898, 'B': 0.08, 'C': 0.021}
Sensitivity to scores
Scores are estimates too, and this is where the analysis gets more useful. See what happens if option A’s technical quality was overestimated:
| A’s score on C1 | A’s total | Situation |
|---|---|---|
| 9 | 8.1 | A leads by 0.8 |
| 8 | 7.7 | A leads by 0.4 |
| 7 | 7.3 | Tie with C |
| 6 | 6.9 | A drops to last place |
A’s advantage depends on a single score. That’s the main result of the exercise, because it says where to spend validation effort: before signing, it’s worth running a proof of concept that measures A’s technical quality with real data. Revisiting the time scores would change much less.
Since each point on C1 moves the total by 0.4, a 0.1 gap between two options is within the error of any assessment. Technical ties should be treated as ties and settled by other factors.
Common mistakes
- Double counting: “license cost” and “total cost” measure almost the same thing and inflate cost’s real weight. The same goes for “ease of use” and “expected adoption”.
- Too many criteria: with 15 criteria, each weighs little and the totals tend to converge.
- Reverse fitting: changing weights until the result matches the initial preference. To reduce the risk, set the weights before seeing the scores.
- Group anchoring: the first score said out loud pulls the next ones. Ask for individual scores and discuss the differences afterwards.
- Scores without a source: if nobody can explain where an 8 came from, it’s a guess and should be marked as one.
How to use an LLM
An LLM helps suggest forgotten criteria, point out double counting, write anchors and propose sensitivity scenarios. It hasn’t tested the products, and prices or features cited from memory may be wrong. Scores should come from your evidence. Check the math in a spreadsheet or script as well, outside the chat.
Help me build a decision matrix to choose between [alternatives].
Objective: [describe].Elimination criteria: [list].Compensatory criteria: [list].Proposed weights, totaling 100%: [list or ask for a suggestion].Evidence per alternative: [data, tests, proposals].
1. Point out criteria that are redundant or don't differentiate   the alternatives.2. Eliminate options that fail the elimination criteria.3. Propose a scale with observable anchors, where a high score   always means more favorable.4. Calculate totals only where there is data and highlight the gaps.   Don't invent scores, prices or product features.5. Show formulas and justifications.6. Run a sensitivity analysis varying the weights of the two most   important criteria and the two most uncertain scores.7. End with a conditional recommendation: what would change the choice   and what to validate before deciding.
Expected output: a weighted table, an explainable ranking, a sensitivity analysis and a list of what to validate.
Before trusting the answer:
- Redo the math. Copy scores and weights into a spreadsheet and confirm the totals.
- Trace every score. A score without evidence goes back on the list of gaps.
- Look for missing criteria. Ask what kind of failure the matrix couldn’t detect.
- Sanitize the context. Commercial proposals often carry confidentiality clauses.
How to present the result
Avoid taking only the ranking to the decision-maker. A good recommendation says which option leads, under which conditions it keeps leading, what would change the choice and what will be validated before signing. In the example: “We recommend A, conditional on a proof of concept confirming a minimum score of 8 on technical quality. If cost represents half of the decision, B becomes competitive”.
Combine it with other frameworks
- Eisenhower Matrix: prioritizes activities by urgency and importance. The weighted matrix compares alternatives across several criteria.
- Cost-benefit analysis: goes deeper into the financial criterion when value over time weighs on the decision.
- Hypothesis testing: validates the most sensitive score with data.
- SWOT analysis: generates the strategic options the matrix will compare.
References
- Pugh, S. (1981). Concept selection: a method that works. In: Hubka, V. (ed.), Review of design methodology. Proceedings of the International Conference on Engineering Design, Rome. Zürich: Heurista, 497–506. Reference
- Kepner-Tregoe. Improve hiring success with Kepner-Tregoe decision analysis. Link
- Monat, J. P. (2009). The benefits of global scaling in multi-criteria decision analysis. Judgment and Decision Making, 4(6), 492–508. DOI
- Parnell, G. S. & Trainor, T. E. (2009). Using the Swing Weight Matrix to Weight Multiple Objectives. INCOSE International Symposium, 19(1), 283–298. DOI
- Dawes, R. M. (1979). The robust beauty of improper linear models in decision making. American Psychologist, 34(7), 571–582. DOI