Product activation dropped, and ten minutes into the meeting there are already three culprits: the model, the onboarding and marketing. Each person points to the area they know best, and the first convincing explanation tends to end the conversation.
The fishbone diagram exists to delay that conclusion. Before choosing a cause, the group widens the field, organizes the possibilities into families and sees what hasn’t been considered yet. The result is a map of what to investigate, in the order worth investigating it.
What the fishbone diagram is
Also called the Ishikawa diagram or cause-and-effect diagram, it places the problem at the fish’s head and organizes possible causes in branches attached to the central spine. Each branch is a category, and each category opens into causes and sub-causes.
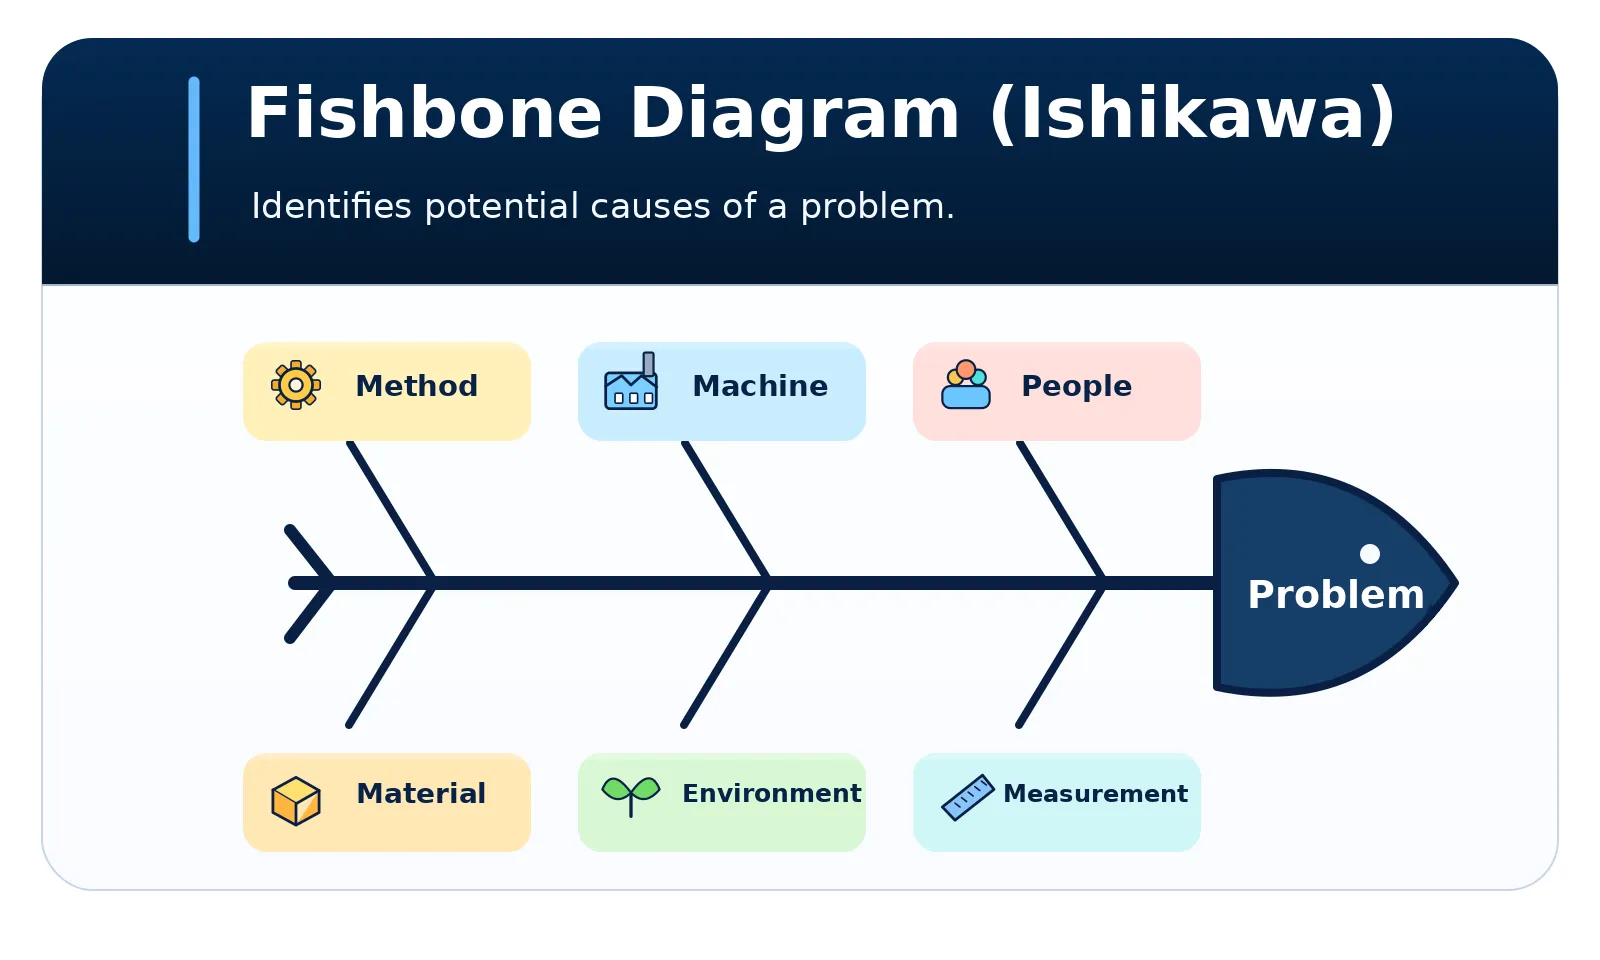
The diagram bears the name of Kaoru Ishikawa, who popularized it in the 1960s through his quality management work at the Kawasaki shipyards. It appears in his Guide to Quality Control, published in Japan in 1968. The date of first use is uncertain, and there are records of the basic idea predating him (Wikipedia).
Categories for software
The categories in the image come from manufacturing. They work for digital products after some translation:
| Category | In software | Examples |
|---|---|---|
| Method | Processes and flows | Onboarding, deployment, review |
| Machine | Infrastructure and models | Latency, capacity, model version |
| People | Users and teams | Training, workload |
| Material | Input data | Quality, format, volume |
| Environment | External context | Customer profile, market, regulation |
| Measurement | Metrics and instrumentation | Events, definitions, sampling |
This list is a starting point. If the problem is engineer turnover, branches such as leadership, career, pay, workload and culture work better. For the diagram to work well, each cause should fit one category without doubt, and the MECE principle helps with that review.
When to use it and when to avoid it
When to use it
- Recurring production failures and service degradation
- A metric drop with no clear explanation, such as activation or retention
- Rework, quality defects and process incidents
- When the group is stuck on a single explanation
When to avoid it
- When the cause is known and the problem is executing the fix
- When the effect can't yet be measured or clearly described
- To assign responsibility to people or teams
- To anticipate failures in a future project: use a pre-mortem
How to apply it
- Define the effect. Write down the metric, period and impact. “Activation fell from 40% to 30% in eight weeks” beats “onboarding got worse”, which already embeds a cause.
- Bring in the people who know the process. Include different areas, so causes don’t come from a single point of view.
- Choose the categories. Use the traditional ones as a base and adapt them to the problem.
- List causes and sub-causes. On each branch, ask what could produce that effect. At this stage, don’t discard anything yet.
- Mark the status and prioritize. Classify each cause, define how to verify it and start with the cheapest to test and the highest potential impact.
Example: activation fell after the launch
A B2B SaaS platform launched an AI assistant along with a new onboarding. An account is considered activated when it saves or shares its first result within seven days.
Effect: activation fell from 40% to 30% in the eight weeks after the launch. Breaking the funnel into stages shows the biggest loss is between connecting data and generating the first result.
| Category | Candidate cause | Status | How to verify |
|---|---|---|---|
| Measurement | Generation event changed at launch | Unsupported | Event audit |
| Machine | First generation is slow on large accounts | Evidenced | Latency by account size |
| Material | Data formats the assistant handles badly | Plausible | Sample of failed generations |
| Method | Onboarding removed the guided example | Plausible | Compare cohorts |
| People | Users don’t know what to ask the assistant | Plausible | Session recordings and interviews |
| Environment | Campaign brought in off-profile accounts | Unsupported | Activation by channel |
Two details deserve attention. The first is the order: it’s worth starting with Measurement, because if the instrumentation changed, the drop may not even exist. Here the audit found no change in the events, and the cause was left unsupported.
The second is the meaning of “evidenced”. The logs show that the slowness exists, but that doesn’t yet prove it caused the drop. Proof will come from going deeper and from an experiment. The two most promising causes move on to the 5 Whys.
How to use an LLM
An LLM helps suggest categories, recall forgotten causes and turn meeting notes into a hierarchical structure. It doesn’t see your logs and may write a plausible cause as if it were fact, so each item’s status has to come from your evidence.
Act as a cause-and-effect analysis facilitator.Observed effect: [measurable problem, period and impact].Context: [system/team/process].Evidence: [data, reports and records].
Structure a fishbone diagram with categories suited to the problem.List possible causes and sub-causes, marking each as evidenced,plausible or still unsupported. Only mark as evidenced what is backedby the evidence provided.
Suggest which data or tests could refute the priority hypotheses.Deliver a hierarchical text representation that can be turned intoa diagram. Don't assign blame to people.
Expected output: a tree of causal hypotheses, each with a status, and an investigation plan.
Before trusting the answer:
- Check the status. A cause marked as evidenced must point to real data.
- Compare with what you know. Ask the team to flag what is wrong or missing.
- Look for absent causes. Ask which category came out weak and why.
- Sanitize the context. Remove customer data and people’s names from logs and reports.
Combine it with other frameworks
- 5 Whys: the fishbone maps hypotheses in breadth, and the 5 Whys go deeper into the most promising ones. The two work well together.
- MECE principle: helps define categories without overlap and locate the problem before the diagram.
- Hypothesis testing: confirms or refutes the chosen cause with an experiment.
- Pre-mortem analysis: anticipates failures before execution, while the fishbone investigates a problem already observed.
References
- Ishikawa, K. (1968). Guide to Quality Control. Tokyo: JUSE. English edition: Asian Productivity Organization, 1976.
- Wikipedia. Ishikawa diagram. Link